Over the last few years, I’ve been incredibly frustrated with inaccurate, unrepresentative data sources about how traffic flows on the web and where web searches take place. Some of these are well-intentioned mistakes (e.g.), while others feel like they’ve got a specific motivation. But one source that’s been consistently excellent is Jumpshot, a collector and provider of anonymized, clickstream-level data from millions of real people’s browsers (both mobile and desktop).
With such a large segment of the United States’ web browsers sending data to Jumpshot, the macro insights are not only valuable, they’re trustworthy. I’ve written about their data previously on Moz and here on my blog, and created several slide presentations that walk through these insights in more depth. Today, I’m excited because I’ve got some new data points to share:
Is Google Gaining or Losing Ground in Search?
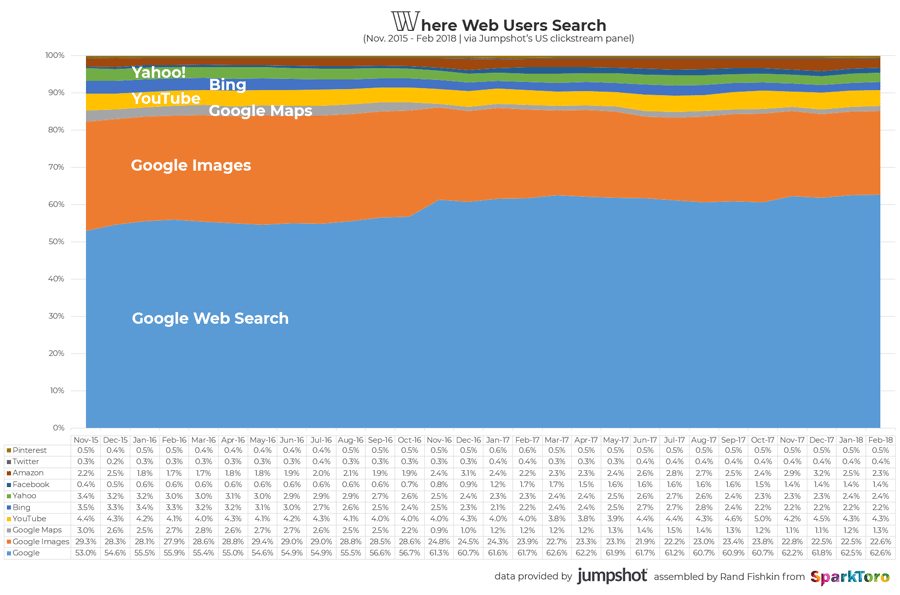
To answer this, we need to see the share of searches over time, and thankfully, Jumpshot gave me data going all the way back to November, 2015. We also need to broaden our ideas about what “search,” can mean, so I asked Jumpshot for data about not just web search engines like Bing, Yahoo!, and Google, but YouTube, Facebook, Amazon, Pinterest, and Twitter too.
The chart below tells the story (and yes, this includes both mobile and web search in browsers and apps):
Some of my takeaways:
- Back in November, 2015, Bing & Yahoo combined for ~7% of all searches. In February of 2018, that number was down to 4.6%.
- YouTube, Pinterest, Amazon, and Twitter have remained surprisingly stable, varying less than a half a percent each. That’s particularly surprising with Amazon, because I keep reading all these stories about how so much of product search is shifting to their platform. If that’s true, it must only be proportional in keeping up with the broad growth of search on the web as a whole. Perhaps that’s impressive by itself.
- Google Images shrunk, but almost entirely because Google web search took that traffic for themselves (dropping the tabs to image search, embedding more image results in the web SERPs, etc)
- Google Maps, similar to Images, only technically lost share, as Google web search gets most of that (and the shift to mobile use has obviously biased that too)
- Google properties own just over 90% of all searches in 2018, up ~1.5% from 2015.
If asked to predict the future, I’d guess that Google’s dominance will continue, and that there’s no clear evidence for a big shakeup anytime in the next 2-3 years. As much as the landscape of search is “always changing,” from a raw use perspective, we’ve entered a fairly mature phase of the industry.
Where Do Searches Happen on the Web in 2018?
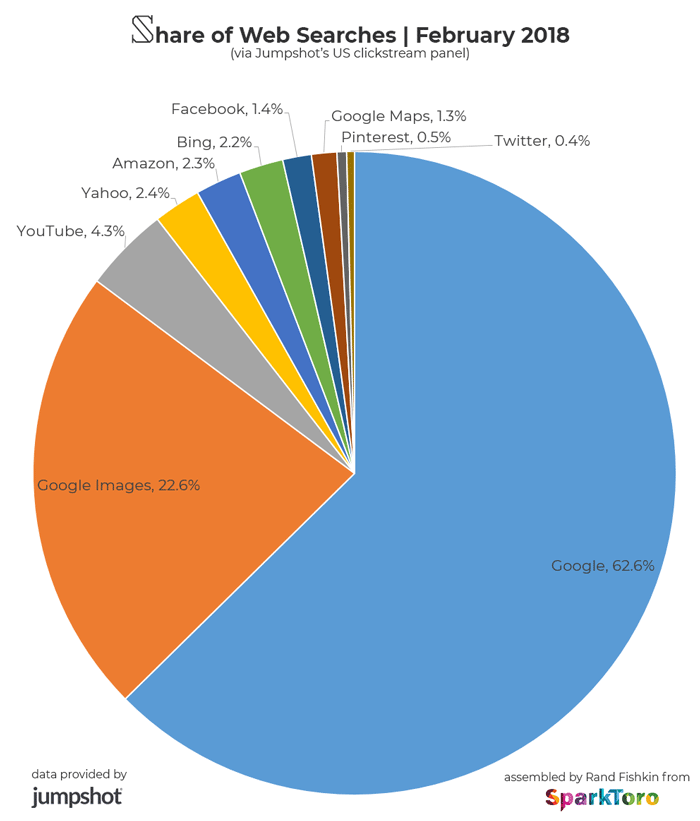
The “over time” view makes trend-spotting easier, but it’s more difficult to break out the differences in size and composition for the various properties. Thus, I’ve also created a classic pie-chart to help illustrate:
Some of my takeaways:
- Given that Google Images is sending out an even more significant portion of traffic (due to their recent changes on “view image”), investing in visual content that can perform there (and appear in web search) feels like a no-brainer for content creators.
- Amazon overtaking Bing in search is definitely interesting, though it looks more like that’s because of Bing’s decline in share vs. Amazon’s rise.
- Facebook, Twitter, and Pinterest look small in comparison to others, but they’re still behemoths compared to the rest of the web, and have maintained growth in search that keeps pace with Google’s own growth (which is quite impressive). For the right brands and markets, appearing in those search results can carry a lot of value.
One very important point on all of this — nothing here suggests that Bing or Yahoo or Google Images have lost searches. This data is all by percentage of share, which means that Bing and Yahoo might have even grown substantively in the last two years and still be down in terms of their share of market, simply because Google and others grew faster.
Please, please, please don’t use this data to say something inaccurate, e.g. “Amazon’s search growth is flat the last two years,” is dead wrong. Google’s number of searches per month has grown massively, and Amazon’s keeping up in terms of percent of market. That’s pretty impressive, and it’s what this data actually reveals.
In the next week, I should have even more new data to share from Jumpshot; stay tuned.
p.s. For more detail on Jumpshot’s methodology, check out this piece from CMS Wire. A huge thanks to Deren Baker, Shaun Rivera, and Saniya Jesupaul from Jumpshot for working with me to get this data.
p.p.s. This data does not include voice answers, though it will include voice searches that result in answers on a screen on mobile (Android) or desktop. Mobile data is Android only (as Jumpshot doesn’t yet collect data at scale on iPhones).

 Click for larger version
 Click for larger version